
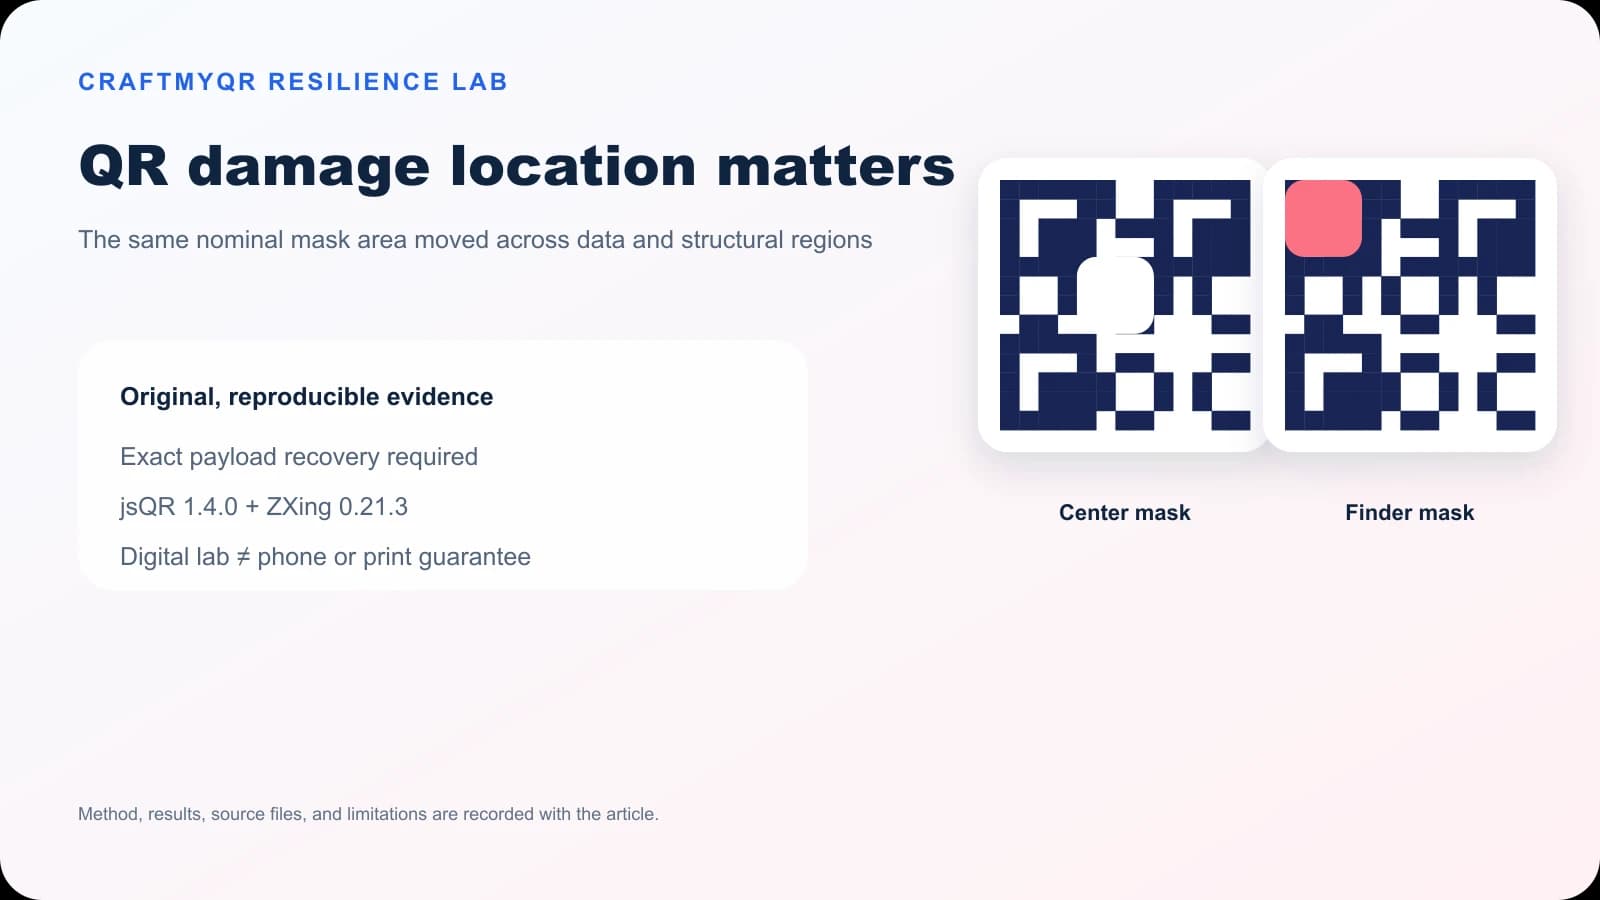
QR code error correction can recover missing or unreadable codewords, but it does not mean any matching percentage of the visible square can be destroyed. Damage location, clustering, structural patterns, symbol density, and image quality all affect recovery. A small obstruction over a finder pattern can be worse than a larger centered obstruction. Build the real symbol in the CraftMyQR generator, then protect its structure and test realistic damage instead of relying on a percentage alone.
Most explanations list L, M, Q, and H with approximate recovery figures. This guide keeps that baseline, then adds a controlled experiment: identical nominal mask areas moved among the center, a finder corner, timing-pattern cells, and distributed positions. The results show why “30% damage resistance” is an incomplete production rule.
QR Code Error Correction Levels Explained
DENSO WAVE documents four QR error correction levels: L, M, Q, and H. Their commonly cited approximate recovery capacities are 7%, 15%, 25%, and 30% of codewords, respectively. Reed–Solomon error correction supplies the redundant information used to reconstruct eligible damaged data.
Those percentages need careful language. They concern codeword recovery under the QR encoding system. They are not a promise that you may cover the same percentage of geometric area, remove a corner, or let ink fill arbitrary modules. Visible area and damaged codewords are different quantities.
Raising the level also consumes capacity. With the same payload, a higher level can require a larger QR version. More modules at the same outer width means smaller detail. A design may gain mathematical recovery while losing camera sampling margin, so level H is not automatically the best answer.
Why Damage Location Matters
A QR symbol includes regions with different jobs:
If a scratch crosses ordinary data cells, recovery may reconstruct affected codewords. If an obstruction prevents the decoder from locating or sampling the symbol, codeword correction may never get a clean chance to run. That is why a damaged QR code can fail even when the marked area looks small.
- Finder patterns help locate and orient the grid.
- Separators distinguish finder patterns from nearby modules.
- Timing patterns help establish the module rhythm.
- Alignment patterns support geometric correction in larger versions.
- Format and version information guide interpretation.
- Data and error-correction codewords carry recoverable content.
- The quiet zone separates the complete symbol from its surroundings.
Reproducible Method
We forced the same product URL into Version 6 at each of the four correction levels. Keeping the symbol version fixed produced a 41 × 41 module grid for every level, which made equal-area location comparisons easier to interpret.
We applied opaque white digital masks at widths of 5, 7, 9, and 11 modules. Four placement rules were tested:
Every case went through four deterministic conditions: clean 260 pixels, JPEG quality 65, 0.6-pixel blur, and 25-degree horizontal foreshortening. jsQR 1.4.0 and ZXing 0.21.3 both attempted each image. A strict pass required both to return the exact original URL.
The masks are digital white erasures. They isolate location but do not model the optical behavior of every scratch, stain, tear, translucent tape, glare patch, or ink smear. Distributed masks also intersect different combinations of dark modules and codeword regions; equal geometric area does not mean equal information loss.
| Placement | Purpose |
|---|---|
| Centered square | Clustered obstruction primarily in the central region |
| Top-left finder-first square | Structural damage beginning at a finder pattern |
| Timing-pattern-first cells | Deterministic cells selected along timing structures |
| Distributed cells | The same nominal count spread through the symbol |
Results: Equal Area, Different Outcomes
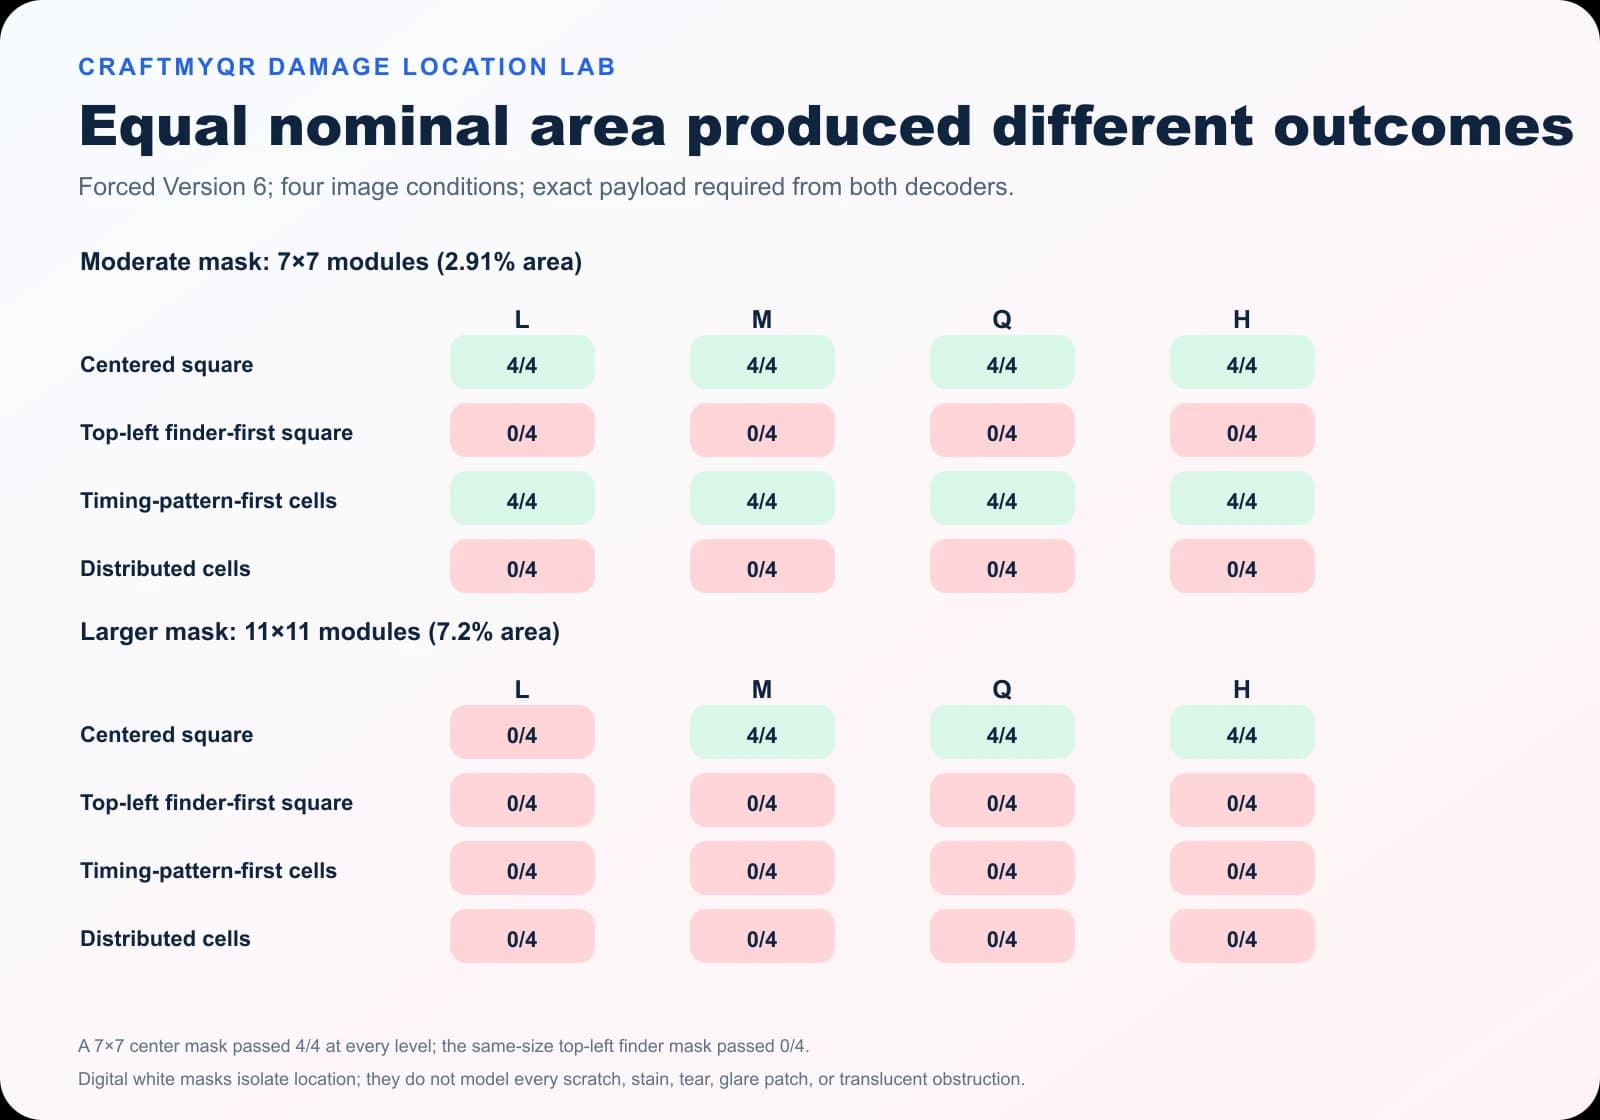
At 7 × 7 modules, the mask occupied 49 modules, or 2.91% of the symbol’s geometric area:
The center and finder masks had the same nominal size. One passed every condition at every level; the other failed every condition. That contrast directly demonstrates the information missing from a geometric percentage.
At 11 × 11 modules, the centered mask occupied 7.20% of the area. Level L failed 0/4, while M, Q, and H passed 4/4. The finder-first, timing-first, and distributed 11 × 11 masks all failed 0/4. In this setup, additional correction helped with a larger clustered central erasure, but it did not rescue the other placement rules.
The 9 × 9 centered mask passed 4/4 at every level, while the other three placements failed 0/4. The transition from 9 × 9 to 11 × 11 exposed a difference between L and the higher levels for the centered case.
| Placement | L | M | Q | H |
|---|---|---|---|---|
| Centered square | 4/4 | 4/4 | 4/4 | 4/4 |
| Top-left finder-first square | 0/4 | 0/4 | 0/4 | 0/4 |
| Timing-pattern-first cells | 4/4 | 4/4 | 4/4 | 4/4 |
| Distributed cells | 0/4 | 0/4 | 0/4 | 0/4 |
What This Adds Beyond Recovery Percentages
The experiment provides four useful additions:
The timing-pattern result also prevents a simplistic story. A 7 × 7 timing-first selection passed, while 9 × 9 and 11 × 11 versions failed. The effect depends on how much of the structure and adjacent information the deterministic rule reaches, not merely the region label.
- Location can dominate area. A 2.91% finder-first obstruction failed while an equal center mask passed.
- Distribution matters. Scattered loss can affect more codeword and structural regions than a compact central square with the same nominal cell count.
- Correction level helps selectively. M, Q, and H recovered the 11 × 11 central erasure; none recovered the tested finder-first pattern.
- Strict results need method context. Four conditions and two decoders describe a reproducible boundary, not a population success rate.
How to Protect a QR Code in Real Use
Choose the correction level according to the expected environment and available size. DENSO notes that M is common, while Q and H may suit dirtier settings. Then address the damage mechanism directly:
For editable campaigns, a dynamic QR code can keep a concise destination in the symbol while allowing the target to change. A shorter encoded path can reduce density, although you must still inspect the generated version.
- Place the code away from folds, seams, perforations, handles, and package edges.
- Keep finder-pattern corners clear of logos, stickers, and decorative frames.
- Add physical margin around labels that may be trimmed inaccurately.
- Use abrasion-resistant print and coating where handling is frequent.
- Avoid reflective laminates when glare can obscure a large moving region.
- Enlarge the complete code if higher correction raises its module count.
Test the Damage You Actually Expect
Generic clean-image scans prove very little about a warehouse label, rental asset, outdoor sign, or food package. Create proof samples that match the failure mode:
Record damage position as well as size. A campaign can pass ten random scratches yet remain vulnerable to one predictable crease through a finder corner. Move the code before increasing correction if the physical layout repeatedly puts structure at risk.
The QR codes in print guide covers size, resolution, and production proofing. If a deployed code already fails, use the QR code not scanning checklist to separate damage from contrast, quiet-zone, distance, and destination problems.
- Rub or scuff representative printed samples.
- Bend flexible packaging at the actual seam.
- Add controlled smears where condensation or handling occurs.
- Test glare from the expected viewing angle.
- Scan before and after the planned laminate or coating.
- Include devices and distances representative of the audience.
Choosing L, M, Q, or H
Level L can suit clean, controlled digital use where code size is constrained and redundancy demand is low. Level M is a balanced default for many ordinary applications. Q and H deserve consideration when contamination, wear, or a centered logo is likely and enough physical space exists.
Do not select by environment alone. Generate all plausible levels and compare version, total modules, and final module size. If H moves the symbol to a denser version that prints too small, enlarging the artwork may be more important than the nominal recovery increase.
A good approval statement is specific: “Version 6, level Q, printed at 32 mm on matte stock passed our device and abrasion matrix.” “Uses 25% error correction” is not a complete production record.
Limitations of the Experiment
The lab did not test physical cameras or materials. White masks create complete digital erasures with sharp edges; real damage may reduce contrast, reflect light, or hide different modules as the viewing angle changes. The forced Version 6 layout controls geometry but does not represent every payload and mask pattern.
Decoder implementations also differ. A phone may apply sharpening, exposure correction, perspective recovery, or multi-frame analysis before decoding. Our strict rule deliberately required agreement from two software libraries. It provides a transparent comparison, not a universal scanner ranking.
Conclusion: Protect Structure Before Trusting Percentages
QR code error correction is valuable redundancy, not permission to sacrifice an arbitrary portion of the image. CraftMyQR’s experiment shows that equal nominal areas can produce opposite results when they land in different regions. Use the CraftMyQR generator to compare levels and density, then protect structural areas and prove the real damage conditions.
For dependable deployment, choose correction level together with final size, placement, material, and expected wear. Move a code away from a predictable fold or finder-corner obstruction before assuming a higher level will recover it.
Frequently Asked Questions
What is QR code error correction?
It is Reed–Solomon redundancy encoded into the symbol so eligible missing or unreadable codewords can be reconstructed. The mechanism improves resilience, but successful recovery still depends on damage pattern, symbol detection, sampling quality, and decoder behavior.
What do L, M, Q, and H mean?
They are the four QR error correction levels, commonly associated with approximate codeword recovery of 7%, 15%, 25%, and 30%. Higher levels add redundancy but can also increase symbol version and density.
Can a level H QR code lose 30% of its visible area?
Not reliably. The familiar 30% figure concerns approximate codeword recovery, not guaranteed geometric area. Damage to finder patterns, clustered structural loss, poor sampling, or a denser version can cause failure well below that visible percentage.
Which QR error correction level should I use?
Level M is a practical baseline for many uses. Consider Q or H for wear, contamination, or a centered logo, provided the resulting version still leaves adequately sized modules in the final placement.
Why does damage to a corner matter so much?
The large corner finder patterns help a scanner locate and orient the grid. If damage prevents reliable detection or geometry estimation, the decoder may fail before its codeword-recovery stage can reconstruct missing data.
Can a damaged QR code still scan?
Yes, when the remaining structure can be detected and the affected codewords stay within recoverable limits. Results vary with damage location, contrast, size, angle, lighting, material, and the scanner’s preprocessing and decoding implementation.
Does adding a logo use error-correction capacity?
An opaque logo backing removes visible modules and relies partly on recovery margin. Keep it centered, avoid structural regions, start small, and test the final code because logo shape and symbol density affect which information is obscured.
How should I test QR code recovery for packaging?
Print the final size on the actual material, apply representative folds, scuffs, moisture, glare, and abrasion, then scan with multiple devices at expected distances and angles. Record both damage position and severity for every result.
Need to create a QR code now?
Create and preview your QR code with our free generator. For long-term materials like menus, packaging and posters, consider upgrading to dynamic QR codes.